Online Introduction to Graphing for Kids
Graphing activities in the classroom can easily incorporate real-life concepts with math learning standards. I love to have students create human bar graphs, pie charts, and more.
Even better is that the students enjoy these hands on activities as much as I do, which doesn’t always happen.
I was teaching a new unit to my 2nd grade students and it involved the introduction of graphing.
We would be covering tally charts, line graphs, bar graphs, and pictographs. As an analytical thinker myself, those concepts seemed fairly straightforward and one I figured my students would have no trouble picking up quickly before moving on to the next chapter in measurement.
So we began with a quick tutorial for the different types of graphs and I whipped a practice pdf in their direction excite to see them fill it out with ease so we could move on to something more challenging.
It was then I realized I was getting the glazed looks from most sets of eyes in my general direction.
Wait?!
This was simple, right? How in the world did I explain it incorrectly?
Of course, years after I had been teaching introduction to graphing, I now know that this reaction is actually normal.
So many new vocabulary terms, new styles of graphs, and knowing when and how to use a specific graph was going to take more practice than a fill in the blank pdf.
My math series was probably going to need some reinforcement from me.

Would you like premade posters to inspire your students?
This pack of 25 colorful watercolor posters includes quotes from famous athletes.
Click HERE to grab them and save yourself time!
Fun Ways to Teach Graphing
I always like to start out new math units by really digging into the vocabulary words.
So much of math is based in using these terms correctly, so taking the time to know them inside and out helps to strengthen the concepts of using the math so much better.
A few vocabulary terms in kid-friendly language for introducing graphing in your measurement standards:
- Data: The group of information you will be displaying in your graph
- Bar Graph: A type of graph that compares 2 or more groups of data. They can be shown vertically or horizontally.
- Line Graph: A type of graph that shows how a set of data changes over time.
- Pie Graph/Circle Graph: A type of graph that displays the data in a circle with the “pieces” of the circle that are larger which show bigger sets of data
- Coordinate Grid: A type of graph that has perpendicular lines in a grid formation with numbers along the bottom and side. You find a specific point on the grid by reading the number across the bottom first, the moving up. Each data point is represented by 2 numbers within a parentheses.
- Tally Chart: A type of graph that involves tally marks in groups of 5
- Pictograph: A type of graph that shows a symbol to tell you how much data is in each category. The key will give you the information for how much each symbol is worth.
- Key: A data box that describes labels. It may tell you how much an icon in a pictograph is worth or what the different colored sections in a pie chart are labeled.
Some hands-on lesson plan ideas:
- Human Bar Graph
Students can make a human bar graph by writing the labels on the board, then having students sitting on the floor in a line behind the label that describes them the most. I love to do “favorite ice cream flavors” for this one.
After students are all in their rows, you can begin creating the bar graph on the board based on their results. They are able to look at the human bar graph both on the board and from within the classroom.
- Classroom Assessment Line Graph
To incorporate real world solutions into teaching how to do line graphs, I integrate student test averages. This could be the weekly reading comprehension test, science/social studies tests, or even the weekly spelling test.
I show students how I come up with the mean average.
Then, I have a bulletin board in the back of the room that has our line graph in progress already made. We make a big deal with a drum roll and I tell students the mean, I graph it, then connect the dots, and students cheer if we “beat our best” score as a class.
The line graph is a permanent fixture in the classroom all year long so we can see how we are improving as a group throughout the school year. This helps to reinforce that line graphs shows data changes over time.
- Hair Color Pie Chart
A fun way to showcase pie charts is for students to sit in a circle.
Then place 3 or 4 labels in different quadrants of the middle of your circle. Perhaps different eye or hair color.
Once students are in a circle sitting next to others with their same data, use yard sticks to separate the results and make sure the labels are in the middle of each section of the pie chart. This makes for a great visual!
- Taco Tally Chart
Ask students to raise their hand if they like tacos. Show how to use tally marks on the board.
Then ask students who does not like tacos. Add those tallies.
As a final step, have students count back and add the tallies to verify that all students answered the question.
- Sibling Pictograph
For a fun pictograph lesson, ask students to go to one of the 4 corners of the classroom based on their answer. Pick a question that has 4 answers. For example, I like “has no siblings, has 1 sibling, has 2 siblings, has 3 or more siblings.”
After students have entered their appropriate corner, create a pictograph (with stick figures) on the board and add the icons as students sit down after being added.
It’s a great way for students to see the information in action.
- Scavenger Hunt Coordinate Grid
Coordinate grids take a little more effort to pull together, but can also create a lot of laughter during the learning.
For this activity, use masking tape or string to create a large grid in the middle of the classroom floor, or on a safe spot of concrete outside that won’t get blown away or disturbed until you complete the activity.
After creating your grid, making sure to label the grad with numbers, figure out a secret message you want to share with your students. Something short, but fun.
Such as “SMILE MORE.” That would take 7 coordinates since there are 7 unique letters in that message: S, M, I, L, E, O, and R.
Write the letters on a piece of paper or use a cutting machine to cut out the letters. Place the letters on random coordinates within your grid.
Then, create a worksheet with the coordinates to figure out the mystery message.
Finally, add other random letters to the rest of the grid so it’s not obvious to students what the answer is.
Have students work in pairs to come up with the correct answer on their handout. It’s hands on and a great way to remember to go across, then up.
Free Teaching Resource for Your Math Lesson Plans
Need some more advanced graphing activities once the elementary students have mastered the basics?
Today I am featuring the website Create A Graph.
This website is great and fun for almost any grade level.
I see it being utilized all year as a practice site so that those graphing skills remain fresh all the way through the spring!
After watching the video above, you will remember that I discussed using it for center practice work and having the students complete independently and print out the graph.
You are then able to assess correctly and place students in small groups to remediate or enrich as needed.
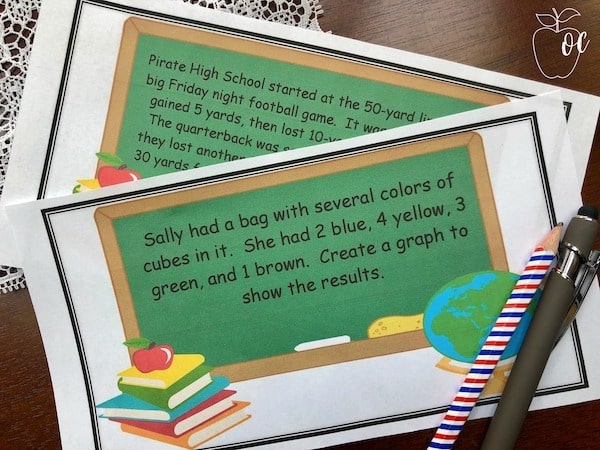
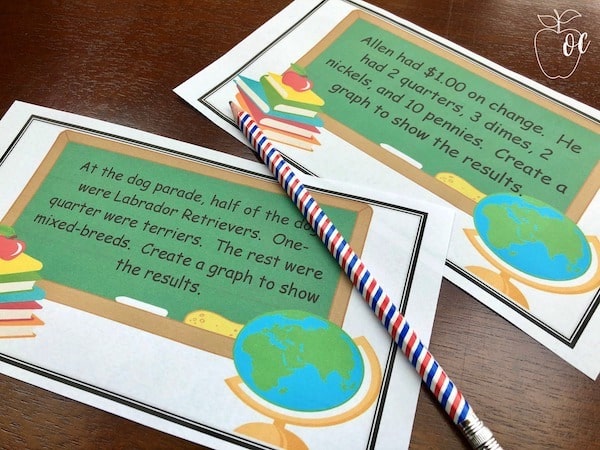
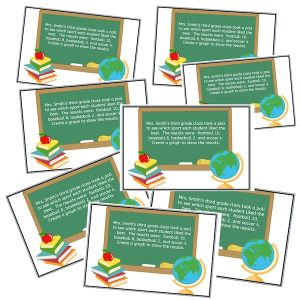
Shown below is a template for some simple story problem cards. There are 8 different problem cards, along with some blanks for you to customize.
Print out on card stock, laminate, and keep the cards in a card file box next to the computer.
As students head back for the week, they can randomly pick out a card, and show a graphical representation of the math scenario and print it out for your review.
Using real-life situations in math is so important, and now you have an easy way to integrate it all together!
How do you introduce data and graphing in your classroom? We would love to hear in the comments below!
~Charity